Introduction
In the bustling roads of Nigeria, a constant battle is fought between safety and chaos. From the crowded streets of Lagos to the serene highways of Nasarawa, road accidents have been an unfortunate part of daily life. This report embarks on a journey through the data collected by the Federal Road Safety Corps (FRSC) from 2020 to 2023, uncovering the hidden patterns, revealing the hotspots, and scrutinizing the effectiveness of policies implemented to safeguard lives. Our mission is to shed light on these dark statistics, to understand who is most affected, where the danger lurks, and how we can turn the tide to make Nigerian roads safer for all.
Exploring the Hotspots
States with the Highest Recorded Accidents
Our analysis begins with an
overview of states in Nigeria, highlighting the states where road
accidents have been most prevalent.
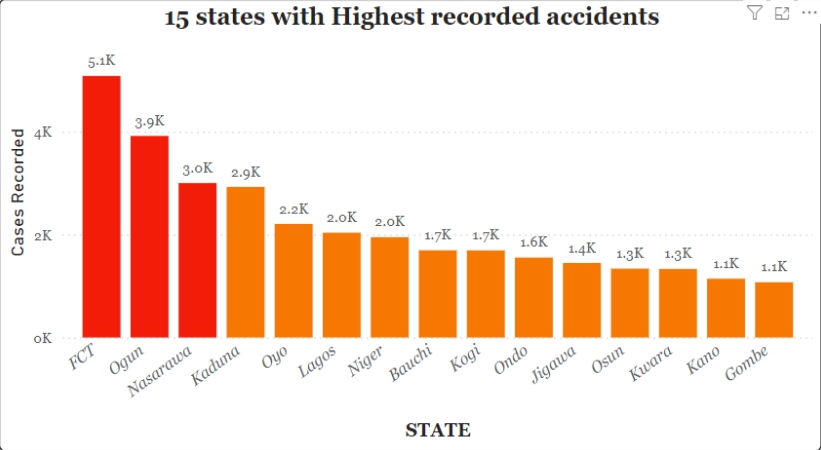
Figure 1 paints a stark picture:
- Federal Capital Territory (FCT): The heartbeat of Nigeria, where the convergence of commerce and governance results in a high volume of traffic. It’s no surprise that FCT tops the list with the most recorded accidents from 2020 to 2023.
- Ogun State: Known for its industrial activities and busy highways, Ogun follows closely behind FCT in the number of accidents.
- Nasarawa: Often overlooked, this state emerges as a significant hotspot, indicating a need for greater attention to road safety.
- Kaduna State: While not the highest in numbers, the severity of accidents here is alarming, making it a critical area for intervention.
- Oyo State: Rounding out the top five, Oyo’s bustling cities and rural roads present unique challenges for road safety.
Fig 1: 15 states with highest recorded accidents
The Grim Reality of Casualties
Severity in Kaduna
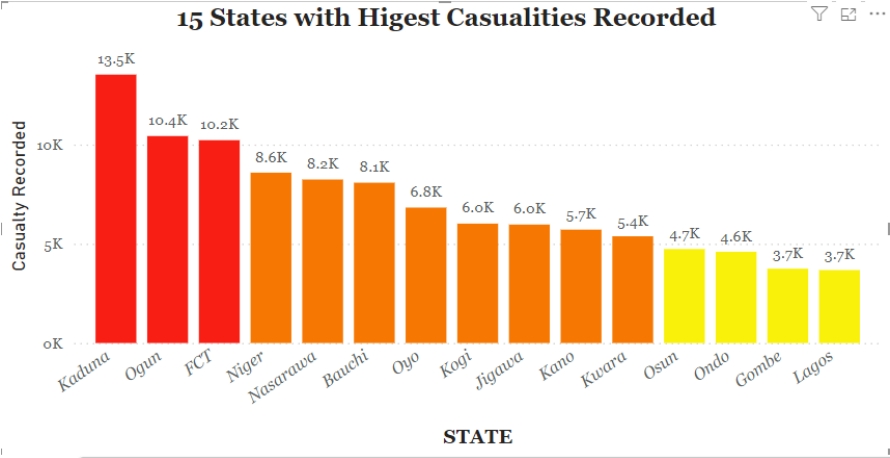
When we dive deeper into the data (figure 2), we discover a grim reality. While Kaduna isn't the state with the highest number of accidents, it bears the heaviest burden in terms of casualties. The accidents in Kaduna are often devastating, leading to a high rate of fatalities and severe injuries. This raises urgent questions about the nature of these accidents and the measures in place to prevent them.
High Casualty Rates in Ogun and FCT
Ogun State is not far behind, with a significant casualty rate that mirrors the severity seen in Kaduna. The FCT also has a troublingly high rate of casualties, reflecting the intense traffic and perhaps the inadequacy of current safety measures.
Figure 2: 15 states with highest causalities recorded
Seasonal Trends and Policy Implications
Quarterly Trends (2020-2023)
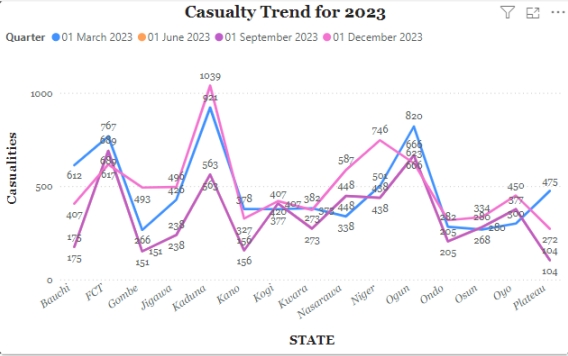
Examining the trends over the years reveals fascinating patterns (figures 3-6). In 2020, the fourth quarter saw a surge in accidents and casualties, followed closely by the third quarter. This pattern suggests a seasonal influence, possibly tied to weather conditions, holiday traffic, or other socioeconomic factors.
Figure 3: Casualty Trend for 2020
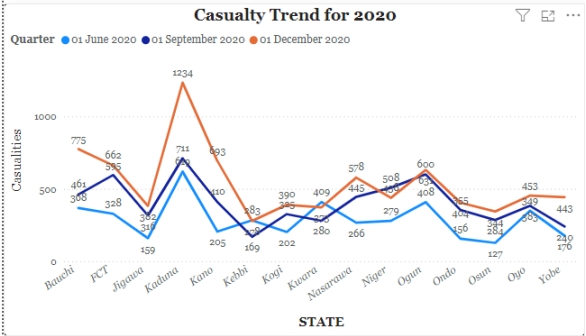
Figure 4: Casualty Trend for 2021
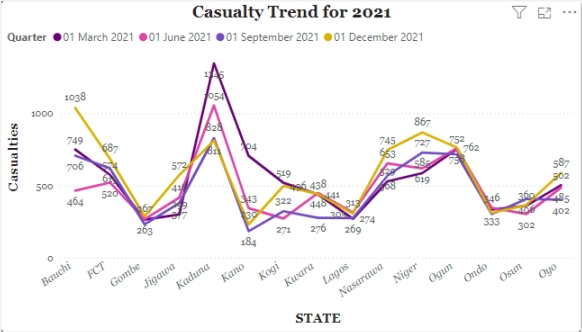
The year 2021 shifted slightly, with the first and last quarters emerging as the most dangerous periods. This trend held steady in 2022 and 2023, underscoring the need for specific interventions during these high-risk times. The data suggests that implementing targeted safety campaigns and stricter enforcement of traffic regulations during these quarters could save countless lives.
Figure 5: Casualty Trend for 2022
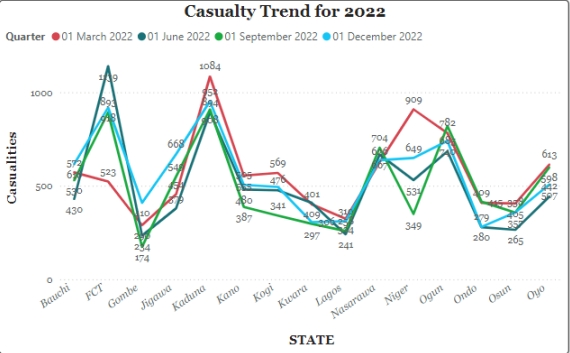
Figure 6: Casualty Trend for 2023
A Demographic Dissection
Who Are the Victims?
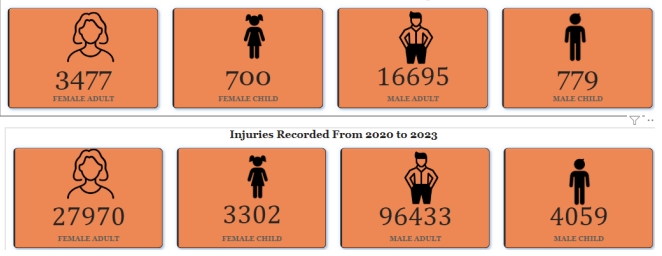
Our journey now turns to the people behind the numbers. Who are the most affected by these tragic events? The data reveals a startling truth: adults, particularly male adults, bear the brunt of these accidents. Male adults constitute up to 83% of the victims, highlighting a demographic that is both highly mobile and perhaps most vulnerable to the risks on the road.
Figure 7: Gender Distribution
Modes of Transportation
The Types of Accidents
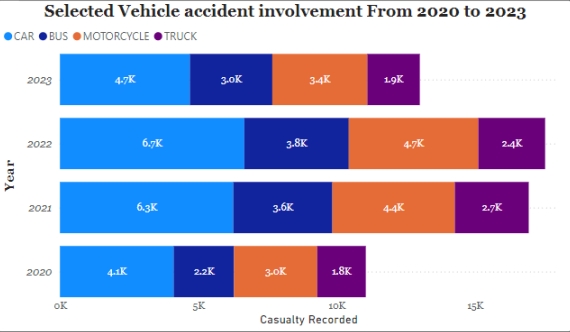
The types of vehicles involved in these accidents provide further insight (figure 8):
- Cars: The most common culprits, car accidents account for the majority of incidents. This reflects the widespread use of personal vehicles and the challenges in regulating and managing their safety.
- Motorcycles:Following closely are motorcycle accidents, a significant concern given the popularity of motorcycles as a mode of transport, particularly in rural and semi-urban areas.
- Buses:Bus accidents also feature prominently, underscoring the risks faced by public transportation users.
Figure 8: Vehicle accident distribution
Regional Variations and Causes
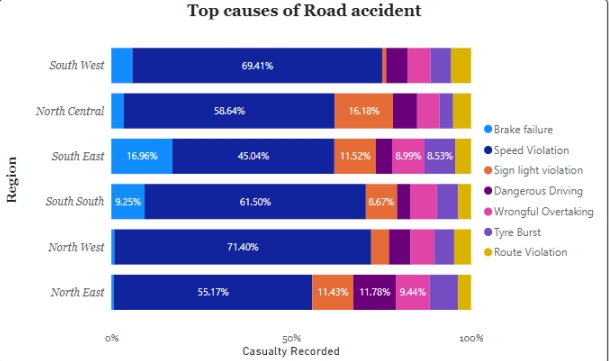
Geo-Political Zone Analysis (figure 9)
Breaking down the data by geo-political zones, we uncover distinct regional variations:
- South West:Speed violations are the primary cause, responsible for 69% of accidents.
- North Central:Similarly, speed violations account for 59% of accidents.
- South East:Speed remains a major issue, causing 45% of accidents.
- South South:The trend continues with speed violations causing 61.5% of accidents.
- North West:A staggering 71.4% of accidents are due to speed violations.
This pattern is consistent across the board, highlighting a nationwide issue with speed regulation and enforcement.
Figure 9: Causes of road accident
Conclusion
Our journey through the data from 2020 to 2023 reveals a multifaceted picture of road safety in Nigeria. The Federal Capital Territory, Ogun, Nasarawa, Kaduna, and Oyo emerge as critical hotspots for road accidents. Kaduna, in particular, stands out for the severity of its accidents, while the FCT and Ogun also bear significant casualty rates.
The seasonal trends indicate a pressing need for targeted interventions during the first and fourth quarters of the year. The demographic analysis points to adult males as the most affected group, necessitating focused awareness and safety campaigns.
The types of accidents and their causes underline the challenges posed by cars, motorcycles, and buses, with speed violations emerging as the predominant cause across all regions.
Recommendations
- Targeted Interventions: Implement stricter speed regulation and enhanced road safety measures in the identified hotspot zones, particularly during high-risk quarters.
- Awareness Campaigns: Launch targeted safety campaigns aimed at adult males to reduce their high involvement in road accidents.
- Infrastructure Improvements: Invest in improving road infrastructure in the most affected states to mitigate the severity and frequency of accidents.
- Policy Enforcement: Strengthen the enforcement of existing FRSC policies, especially those related to speed violations, to ensure better compliance and safety on the roads.
- Data-Driven Approach: Continuously collect and analyze road accident data to identify emerging trends and adapt strategies accordingly.